Intersectionality
Intersectionality
/ˌɪntə(ː)ˈsɛkʃənælɪti/ (n.)
|
Philosophy

|
The interconnectedness of categorisations within a population as they apply to a given individual or group, particularly insofar as they overlap or intersect to create interdependent systems of discrimination or privilege.
The term “intersectionality” was coined by Kimberlé Crenshaw and is an important analytical framework within critical theory for understanding how aspects of a person’s social and political identities combine to create different modes of discrimination or privilege in that person’s community.
Now far be it from the JC to wade into these roiling waters: he’s seen his 23andme profile, and it’s irredeemable — but, being a contrarian, he did want to play around with spreadsheets a little bit and think about Venn diagrams.
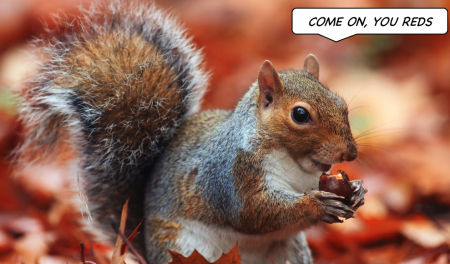
This being an intellectual inquiry rather than a political one, let’s visit our favourite local population of squirrels. In the north London squirrel community (for the sake of this argument) squirrels can me mapped to four binary, but overlapping classifications: fur colour (grey or red); nut preference (acorns or chestnuts); tail fluffiness (bouffant or ratty) and community position (senior or junior). In each case there is an in-group (where possessing this quality is an advantage) and an out-group (where possessing the quality is perceived as a disadvantage. In most cases this maps to minorityship; nut preference is distributed evenly, but chestnut-loving squirrels are generally accepted to be disadvantaged in foraging potential (since chestnuts are heavier). The categories break down as follows:
| In group | Out group | |||
|---|---|---|---|---|
| Quality | Proportion | Quality | Proportion | |
| Nut preference | Acorn | 50% | Chestnut | 50% |
| Fur colour | Grey | 95% | Red | 5% |
| Tail fluffiness | Bouffant | 99.6% | Ratty | 0.4% |
| Community | Youthful | 66% | Elderly | 34% |