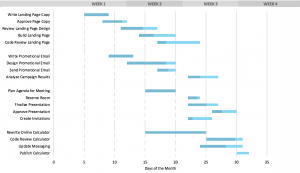
Gantt chart
A Gantt chart is a rarefied view of the world much beloved by project managers and management consultants because it shows in beautiful simplicity how a complex project will autonomously move from inception to conclusion like a beautifully structured, if machine-like symphony.

They are, thus, profoundly wishful things. They operate in the same Utopian intellectual space as sunlit uplands, socialist manifestos and Twitter campaigns. The real, party spoiling world will unfailingly intervene so that in practice, no project ever remotely tracks its Gantt chart, but that doesn’t matter because no-one looks at Gantt charts for the past. Beyond some bored middle-manager on an operating committee no-one pays them much attention at all, in fact.
Probable completion dates for any project, and any milestone in any project, are asymmetrically distributed because time’s arrow flies only one way. If I expect a task will take a week and everything goes according to plan, it might get done in 4 days. Whatever happens, it is physically impossible to complete the task more than a week early: time’s arrow only flies one way. On the other hand, delays of any kind, especially where there are inter-dependencies between delays, can only push the expected completion date one way — out — and they can do this indefinitely.
A project your Gantt chart said would take a week might take three days — great: you’ve saved two — but it might take six months.