Normal distribution
A Gaussian, or normal distribution of a series of events, indicates that the events are independent of each other, in that the occurrence of one does not affect the probability of another. Coin flips are independent of each other. So are rolls of a die, or the distribution of heights in a classroom. Homo sapiens being the fickle, biddable species it is, its cognitive decisions — particularly those concerning fashionable ideas, to depart quickly from crowded theatres when someone yells fire or to hysterically buy, and then sell, Enron stock for fear of missing out — are not.

|
Independent events
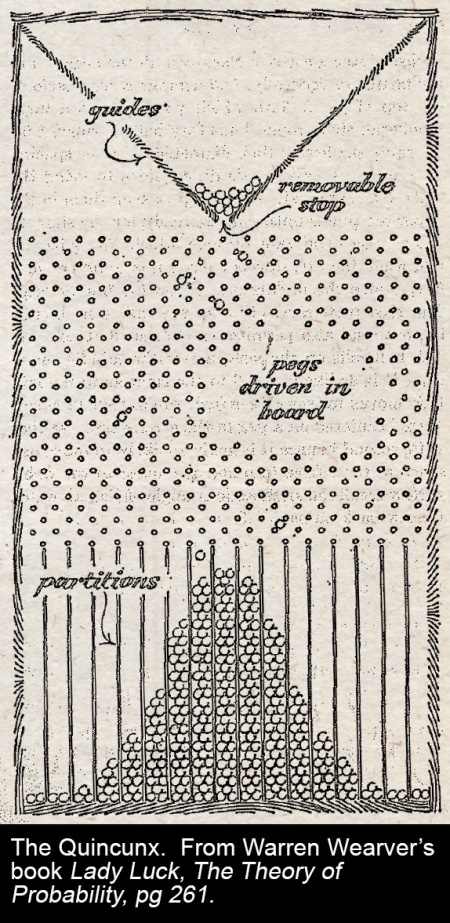
Independent events fit nicely to a bell curve, as the quincunx pictured, likes to demonstrate. Bell curves confidently prescribe standard deviations, probability intervals, and allow one the comfort to say, “the odds of x are such that one wouldn’t expect it in several lives of the universe”. When x really is an independent event (or a series of them) this is prudent enough: “the odds of flipping a coin and getting 99 consecutive heads is 0.5 x 1099, which you wouldn’t expect in several lifetimes of the universe.”
Dependent events
“[Waymo] staff lamented that they have got 99 or cent of the way there but ‘the last 1 per cent’ — the hump that Full Self-Driving will need to get over to live up to its name — has proved hugely complex.”
- —“Gimmicky Musk hits the skids”, The Sunday Times, 22 August 2021
Then there are those “ten-sigma” events — like, ooooh, say the correlation of a Russian government default with a spike in the price of all other G20 Treasury securities, just to pick something at random — that should, in the world of normal distributions, happen only once in every 1024 times — say, ten million years — but, since investment decisions are not even remotely independent events, happened once— and only needed to happen once, to blow Long Term Capital Management and much of the market to smithereens — in four years.
These persist in occurring “against all odds” because they are a product of dependent events. The distribution of patrons’ arrival times at a cinema are normally distributed around the prescribed showtime because, outside that control, the time at which I show up has no bearing, or dependency, on the time Mrs Pinterman shows up. The chance that all 400 people should arrive and try to enter the theatre at the same moment is more or less nil.
But when Mrs. Pinterman then cries “fire” the situational dynamic is very different. Everyone tries to leave at once. Even those who didn't hear Mrs. Pinterman directly, because they instinctively copy everyone else,who did.
When assessing probabilities, therefore, pay attention to the dependency of the events. If events are interdependent, normal distributions to not apply.
This seems an obvious lesson; the JC feels less patronising about stating it since failure to heed it led to the collapse of LTCM and the global financial crisis.
“We were seeing things that were 25-standard deviation moves, several days in a row.”
- —David Viniar, Chief Financial Officer, Goldman
The probability of a 25 standard deviation move is 1.309 x 10 ^ 130. You see this figure cited frequently, but to a lay person, it doesn't really make the same impact as writing it out, so let's to that.
1 in 1.3 billion billion billion billion billion billion billion billion billion billion billion billion billion billion.
By comparison, the earth is 1658 billion days old, and the universe itself ten times older than that. So we are talking about an event that you would only expect once in several billion billion billion billion billion lives of the universe, happening several days in a row.
Enough already of the chutzpah.[1] the practical lesson is that, unless it's a normal distribution, 99 per cent of the way there isn’t good enough. All existential crises sit in the last 1 per cent, because the feature of an existential crisis is everyone panicking and selling at once. These are, by definition, the events a normal distribution says will not happen.
See also
- Social proof: the figures implied that it would take a so-called ten-sigma event—that is, a statistical freak occurring —for the firm to lose all of its capital within one year.
- ↑ But, get your coat, you know?