Breakage costs
|
Banking basics
A recap of a few things you’d think financial professionals ought to know
|
Breakage costs
/ˈbreɪkɪdʒ kɒsts/ (n.)
Breakage costs arise because a lender of money for a fixed term is exposed to changes in interest rates over that term. It will have — can be assumed to have — hedged the interest rate risk of providing those funds to the end of the committed period, so if it has to unwind its interest rate hedges beforehand to repay the money, it may make a gain or loss.
The size of interest rate breakage costs will therefore be a function of (i) how far the prevailing market rates have moved since the contract rate was set, and (ii) how much time remains to the end of the present fixed commitment period. There will be often be a “hump”: breakage costs will tend to increase as the market rate diverges from the fixed rate (on day 1 they will be the same) then decrease again as the number of days remaining in the fixed term period (by which the increasing differential is multiplied) diminishes to zero.
The breakage costs on a 5-year fixed period on a mortgage loan are therefore, potentially large, which is why it is so expensive to repay a fixed mortgage early. The breakage costs on loan that resets its interest every month (a floating rate loan) will be much smaller. The breakage costs on overnight deposits will be, by definition, nil.
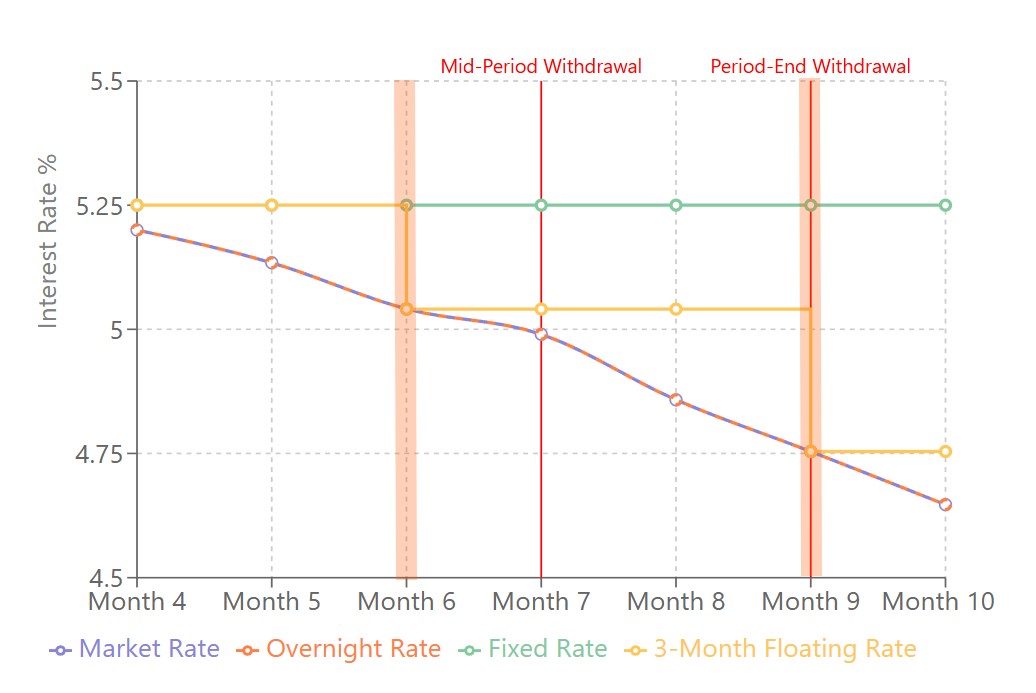
Consider the diagram in the panel: it illustrates a fixed rate (green, 5.25%), a three-month floating rate resetting on months 6 and 9 (light orange) and an overnight rate (dark orange) in a rapidly falling interest rate market environment (blue). We can see that the breakage cost (the difference at any point between the contractual rate and market rate times time remaining at that rate) is most severe for the fixed rate loan and least severe for an overnight deposit.
Because the overnight fixed rate and the market rate track each other, there is no breakage cost payable on an overnight rate. The three-month rate necessarily diverges from and then converges to the market rate at the start of each three-month calculation period (denoted by the glowing orange bars), so the breakage costs are manageable. The fixed rate of 5.25% does not — The diagram does not illustrate how long the fixed term period is, but let’s say it was 5 years, and the floating interest rate fell to zero (did happen!) then the price for exiting that fixed rate loan would be the total sum of all outstanding interest.
This reflects the lender’s opportunity cost of foregoing the 5.25% interest income in an environment where market rates are zero.
Swap break costs
The same principle holds for swap break costs, only the comparison will be the prevailing market rate for the reference asset against its value when the swap was executed (its “strike price”).
On the trade date, an asset’s strike place and its market price are, Q.E.D., the same. On any other day swap break costs will generally be simply the breakage cost of the asset leg, payable one way, less the breakage costs of the financing leg, payable the other. The financing leg is explicitly an interest rate breakage cost; the asset break is by analogy one. In each case, the same “time decay” effect and “duration hump” effect should be in play.
