Bottom of the range: Difference between revisions
Amwelladmin (talk | contribs) No edit summary |
Amwelladmin (talk | contribs) No edit summary Tags: Mobile edit Mobile web edit |
||
| Line 1: | Line 1: | ||
{{ | {{aai|disaster|{{image|disaster cafe|jpg|Would you like some hubris with that, Mr Plotkin?}}{{image|GME|png|Ouch ouch ouch}}}}{{not investment advice}}{{d|Bottom of the range|/ˈbɒtəm ɒv ðə reɪnʤ/|n}} | ||
A bad place to be structurally [[short]]. | A bad place to be structurally [[short]]. | ||
Revision as of 16:41, 23 December 2022
|
Chez Guevara — Dining in style at the Disaster Café™
Here is what, NiGEL, our cheeky little GPT3 chatbot had to say when asked to explain:
|
This is not investment advice. Seek professional help before — ideally, instead of — acting on it.
Bottom of the range
/ˈbɒtəm ɒv ðə reɪnʤ/ (n.)
A bad place to be structurally short.
An asset’s “range” is the variation of prices at which it has traded over a period. The longer the period, the more meaningful the range and the more confident you might feel, all other things being equal, that the asset’s price will stay in that range in a particular forward period. This confidence is relative to the length of the forward period and the length of the range.
For example: if an asset has traded between 5 and 15 over the last decade, and is presently trading at 7, it is unlikely to trade at 20 in the next hour. It might do — but that would be weird. Your confidence level should drop as your forward time horizon extends: the asset could trade to 20 in the next month; it may well do so over the coming year.
Now you all know the JC is a “words” fellow and doesn’t really understand, or like, numbers. So take this in the spirit of joyful innumeracy in which it is imparted. This is not science but a heuristic; it owes little to advanced maths, quantitative modelling techniques or principles of probability (which typically do not work with complex adaptive systems) and a lot to the Lindy effect, or the principle of mean reversion.
Corollary: if your asset has traded between 5 and 15 in the last decade, has been gradually declining, and it is currently trading at 5, it is not implausible to suppose it could go back to 15 in fairly short order. This ought to be food for thought to short sellers, who stand to gain 5 at most (i.e., the gap to zero), and could therefore lose 10, or more, in that non-unlikely scenario.
GameStop and the outsider traders
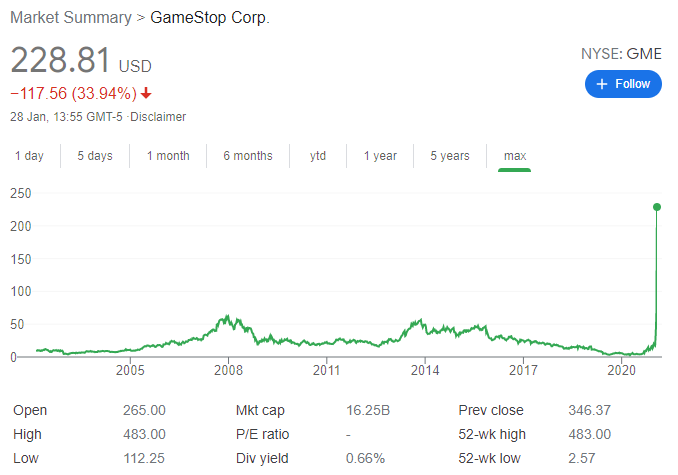
We have looked elsewhere at the travails of Melvin Capital Management LP when it tried to short GameStop, but this points to a general proposition: if your strategy involves prices staying low, or going lower, be careful when investing at the “bottom of the range” of plausible prices. Your arse is hanging out.
An equity cannot have a negative value — not even one as ropey as GME — so there is a natural limit to how much you can make by shorting it: your purchase price. The lower that price, the less, in absolute dollars, you can make by shorting a single share (but the more shares you can afford to buy!!!) This is where the significance of the range comes in: if the stock is already low against its historical range, and low in absolute terms — as, by 2019, was GME — there is only so much further it can go: if Melvin put on its short at $1.00, it stood to gain at most $1 per share. But it is hardly outlandish to suppose a stock could return to points higher in its range: after all, it has been there before. The stock might seem in terminal decline, but look: things can change. Even without the mendacious activities of the Reddit “outsider” traders, it wasn’t crazy that GME could go back to $15.00 per share. Even this kind of move would be crippling: Unlike a “long” position, a short sale requires you to borrow — not a fixed amount of cash, but the prevailing value of security you are shorting. Since you don’t have that stock — you sold it short — if it rises, so will your margin obligation to your broker. You will have to fund that in cash. So a $1m investment in GME — promising a maximum $1m return — would require $15m of margin, if the stock rallied even to historical levels. This is scary gearing for an uncertain future.
By contrast, putting on a short position at $15 — a price at which GME had not exceeded in twenty years — gears things the other way. To lose just one times your investment, GME would need to go to $30. To lose 15 times, it would need to go to $225 — a (seemingly) outlandish price. Of course that is exactly where it did go — beware of predicting the future is a different lesson — but here bear in mind: had Melvin put on its short at the top of the range, it would have lost only 15 times its investment. Had it invested at the bottom, it would have lost 225 times its investment.
This is also a good illustration of the second loss risk. Of course, as we know, Melvin didn’t have anything like 225 times its investment in cash. The point where it is wiped out, then someone else is wearing the rest of the loss. Welcome to the table your friendly, well capitalised, prime broker and its unsuspecting shareholders. You are just in time to pick up the bill.
Low mortgage rates: a sleeping dog?
We see a similar thing with mortgage rates. Historically, interest rates have been between 1 and 10% — though perhaps only those of the JC’s vintage will believe that rates could ever have been above 2%. In the seventies, eighties rates were constantly between 8 and 15%.
Rates, we know, as a central bank tool for controlling inflation. They will periodically move, by half or ever quarter point moves, and since monetarists slew the inflation dragon in the eighties, they have stayed with a much, much lower range (except, curiously, in New Zealand. Hello, carry trade!)
But it is one thing looking at this from the prism of fiscal policy. Looking at it from a home-owner’s perspective tells a different story. You put on your borrowing mindful of the cost of doing so: the potential range of future interest costs. You borrowing is fixed for a short term, but your investment is illiquid — no-one moves home for the hell of it — so you have risk to interest rate movements.
A borrower’s tolerance for increases in her funding costs (which she meets with her salary) is say 50% of her total funding cost: this means if borrowing costs increase by more than 50% she can’t meet her payments and will have to sell, or default, on her mortgage.
Now if she borrowed at 8%, she could handle a whole point rise: that’s an eleven percent increase in your cost of funding, but she can sell the car, cancel Netflix, do without that Starbucks and so on to manage that. Her pips will start to squeak at about 4 points, being 50% increase in her mortgage borrowing costs.
But if she borrowed at 0.75% — as many have today — a rate rise of 1% is a 158% increase in her cost of funding. Doubling, and half again, your mortgage payments, just to service interest. Where is she going to find the money to pay that?
Now one forced mortgagor seller is a tragedy; half a million of them are a generational cataclysm. The implications on the housing market if everyone is forced by rising finance costs, to sell at once, is not pretty.


