Ergodicity: Difference between revisions
Amwelladmin (talk | contribs) No edit summary |
Amwelladmin (talk | contribs) No edit summary |
||
| Line 40: | Line 40: | ||
=== Ensemble probabilities and time series probabilities === | === Ensemble probabilities and time series probabilities === | ||
[[File:Ensemble vs time.png|frameless| | [[File:Ensemble vs time.png|frameless|right]]In fact, the group as a whole ''won’t'' make money each round. | ||
Why? Because the ensemble average ''means nothing for any single player''. ''No one'' scores a constant 105% return. Players score ''either'' 150% ''or'' 60% and then invest their winnings in the next round. Their expected payoff through time is therefore not the snapshot ''average'' of the winning payoff and the losing payoff — that is a return the player certainly won’t get — but the ''product'' of the winning payoff ''multiplied by'' the losing payoff (i.e., 90%). | Why? Because the ensemble average ''means nothing for any single player''. ''No one'' scores a constant 105% return. Players score ''either'' 150% ''or'' 60% and then invest their winnings in the next round. Their expected payoff through time is therefore not the snapshot ''average'' of the winning payoff and the losing payoff — that is a return the player certainly won’t get — but the ''product'' of the winning payoff ''multiplied by'' the losing payoff (i.e., 90%). | ||
| Line 57: | Line 57: | ||
=== Salaries === | === Salaries === | ||
[[File:Ensemble vs time 2.png|frameless| | [[File:Ensemble vs time 2.png|frameless|right]]So, therefore if we all pool our resources and lead an anarcho-syndicalist community existence we will all be rich, rich, rich? | ||
No. Put away ''Das Kapital''. | No. Put away ''Das Kapital''. | ||
Revision as of 18:09, 23 August 2021
|
|
Fans of Nassim Nicholas Taleb and Rory Sutherland will know all about it, but for mathematics clots like me, it’s new, and it’s taken two weeks to get my head around and I probably have it wrong. I am no mathematician and I’m in way over my skis here — but since it’s the only time that’s going to happen in season 20/21, I’m going to enjoy it.
You could cut straight to the chase and watch Ole Peters explaining it in a lecture to Gresham College about eight years ago in the panel to the right ==>
But anyway let me try. In what follows, to make it easier, I am assuming coins cleave exactly to their probabilities at all times. It would be possible to get different results by improbable sequences, but the longer the sequence the more improbable variations become.
Ergodicity compares the payoffs of series probabilities — one person repeating a single action several times — with those of parallel probabilities — several people performing a single action once each. If those two payoffs are the same, the event is “ergotic”.
Ergodicity is less common than you would think, and even where you have it, it doesn’t take much to scare it off.
For example, the probable outcomes from flipping a coin are ergotic. It doesn’t matter if ten people flip a coin once, or one person flips it ten times, the odds are the same: 50:50.
But if our coin flippers bet on their flips, their expected return is not ergotic.
When flipping coins isn’t ergotic
Imagine a game where you stake £10 on a coin flip, and “heads” wins 50% but “tails” loses 40%.
Good game, right?
If ten people play one round, their average expected return, across the group, will be better than even. We expect five to win (return: £75), and five to lose (return: £30). The group, collectively, expects to return £105. On average, therefore each player will be $0.50 up, although of course no player actually wins £10.50. Of course you would: (150+60)/2 = 105. Simples.
This is an “ensemble” average.
But if one individual in that group plays ten rounds of that game, investing her winnings each time, her odds are worse than even. This is because, through time, you multiply outcomes, rather than averaging them. We can see this after just two flips: one she loses one she wins (fifty-fifty is her expected success over time).
Round 1: 10 * 1.5 = 15.
Round 2: 15 * 0.6 = 9.
It’s the same the other way round, by the way, because multiplication is commutative, a piece of intelligence I credit to my fourth form maths teacher, Mr Ellison.
Anyway, after two rounds, our player has less money than she started with. Probabilities say that trend will continue. On average, through time, she will return 90% each round (150% * 60%).
Therefore, weirdness number 1: the probability for one player flipping ten times in a row is worse than the probability for a group of ten flipping once each.
That means, weirdness number 2: Everyone in the group, individually, stands to lose money over time, on average, even though the group as a whole looks like it should make money each round.
Like, what?
Ensemble probabilities and time series probabilities

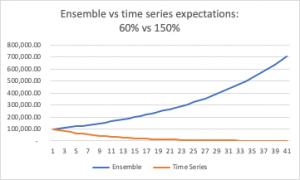
In fact, the group as a whole won’t make money each round.
Why? Because the ensemble average means nothing for any single player. No one scores a constant 105% return. Players score either 150% or 60% and then invest their winnings in the next round. Their expected payoff through time is therefore not the snapshot average of the winning payoff and the losing payoff — that is a return the player certainly won’t get — but the product of the winning payoff multiplied by the losing payoff (i.e., 90%).
This is the amount over time, each player should expect to win. Or, in this case, lose:
This is the logic of the casino: the more you play, the more, inevitably, your investment will tend to zero.
One thing to note here: the group can change this if they co-operate. If all players combine their returns and share them out after each round, everyone can expect to have 105% to invest each round. Then they will track the ensemble average.
Now before you crack out the Communist Manifesto, note: no casino on Earth would offer a game with an ensemble average payoff of greater than 1, for precisely the reason that the house is a sure-fire loser if punters have the gumption to collaborate.
So these conditions won’t prevail in a betting context, but there is one place you might find them, where generally the time-series average already is greater than 100%.
Like, work. Over time, you expect your salary, on average, to go up.
Salaries

So, therefore if we all pool our resources and lead an anarcho-syndicalist community existence we will all be rich, rich, rich?
No. Put away Das Kapital.
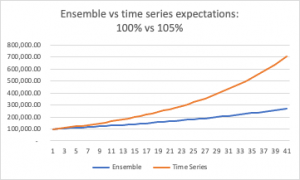
Alas, when the time series average is greater than 1 — as we like to think it will be over a lifetime’s work, where we get better paid the more skilled we become — it turns out to be to everyone’s advantage not to share returns. In this case, the individual time series expectation compounds much more quickly than the ensemble average does.
If you have a 50:50 chance of a zero per cent pay rise and a 5% pay rise, over 40 years your own trajectory will wallop the group average:
So squirrel away your nuts and keep your whiskers to the grindstone.
The Bill Gates fallacy

All this is because, the snapshot average across a group of salaries doesn’t tell you anything about your own expectation through time. An “average salary” is an emergent property whatever group you choose to average: it is arbitrary. You can’t see it in any single salary.
This is why, when Bill Gates hops on a London bus, he makes everyone on board, on average, a billionaire, even though 79 other people on the bus earn exactly what they did before he arrived and the bus average was £25,000.
So the ensemble average doesn’t tell us much, yet, because it is readily available, we tend to focus on it. But more important to an employee ought to be her time-series payoff: how she should expect her salary to rise — or fall — over time. That probability compounds.
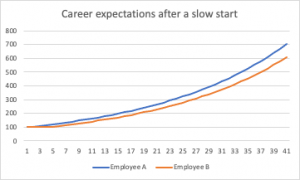
Compare two 40-year careers: one with a constant annual pay rise of 5%, and one that starts with three “lean” years with no pay rise, but then follows that with 37 years of a 5% pay rise.
That initial difference in money, after three years, is small in the context of a lifetime’s earnings: £31,000.
But the compounding effect afterwards, even though both are making the same 5% return, is massive: after 40 years their salaries are nearly £100,000 apart, and over the 40 years, the aggregate earnings differential between them is £1.7 million:
Try not to have a slow start to your career, folks.